Listen to NavamAI Podcast
Trending Models
Each navamai test command run saves the test summary data in Metrics folder by timestamp and provider-model. Over time you can visualize trends of latency and token count metrics to see if models are performing consistently. Run navamai trends command to view trends for 7 days (default).
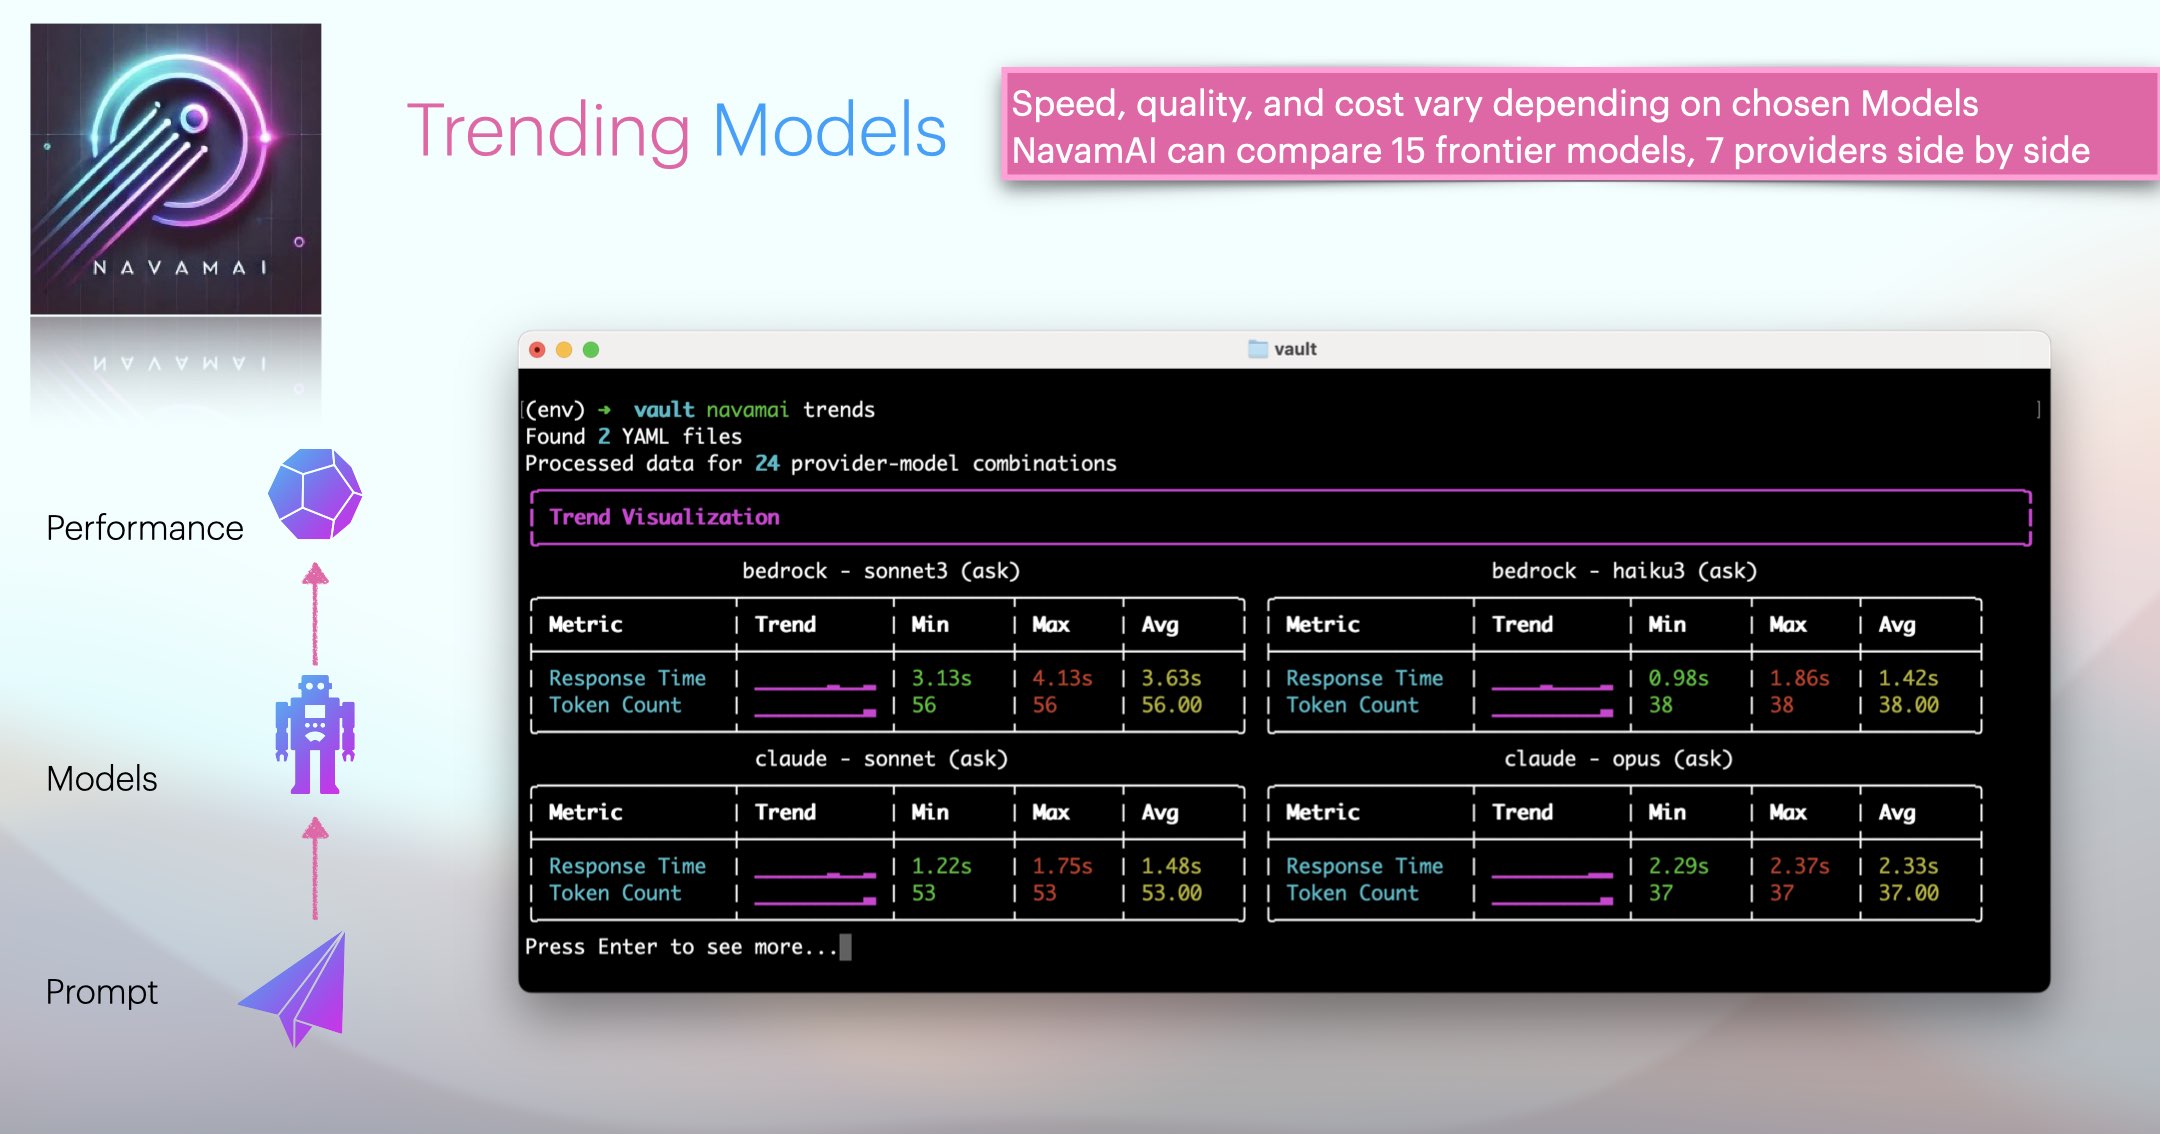
The visualization uses sparklines to show data trends over time. Use this to decide when/if to switch models based on performance trends.